
The Psychological Safety survey measures how safe students feel to be themselves, speak up and take risks at school. It gives you a school-level view of belonging and safety that sits alongside your regular wellbeing surveys.
What is psychological safety?
Psychological safety is the shared belief that it is safe to take interpersonal risks, such as asking a question, admitting a mistake or sharing an idea, without fear of embarrassment or punishment. The idea comes from research by Professor Amy Edmondson at Harvard.
Students who feel psychologically safe tend to have greater academic success, more positive relationships and more pro-social behaviour. They take risks without fear, are more creative and feel a sense of belonging.
About the survey
- Who: students aged 10 and over.
- What it covers: the three core elements of psychological safety: individual safety, respect and learning environment.
- Type: a focused benchmarking survey. It measures students' experience of the school environment, not their personal wellbeing or characteristics.
- Results: stand-alone. They are not included in overall wellbeing scores.
- Anonymity: you see school and cohort results, not individual student scores. This is deliberate, because the research shows interventions work best at a system level.
How often to run it
Run it two to four times a year, for example once a term. Repeating it lets you compare results over time and see whether your strategies are working. Running it more often can cause survey fatigue and reduce data quality.
Assigning the survey
- Go to Surveys and open the Survey Library.
- Find the Psychological Safety template.
- Assign it to the year groups aged 10 and over, and set the dates.
It can run alongside any other Komodo survey. See the Guide to creating surveys for scheduling tips.
Reading your results
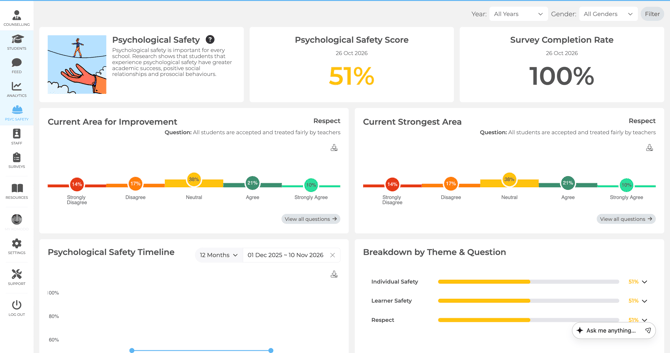
The Psychological Safety analytics page shows three numbers:
- Latest Psychological Safety score: look for trends over time. Do not aim for 100. A perfect score suggests misreporting, and even the safest schools see natural changes.
- Latest engagement score: how many students completed the survey, which tells you how representative the score is.
- Scheduled surveys gone live: how many have run this school year.
And three graphs:
- Psychological Safety timeline: whether the school is improving, holding steady or struggling.
- Year group comparison: a year group scoring much lower may need support. One scoring higher may show practice you can share. Similar scores suggest a consistent experience across the school.
- Correlation with student wellbeing: clusters in the top right show high safety and high wellbeing together. Clusters in the bottom left show both are low. A scattered graph suggests a weak link.
Taking action
Focus on whole-school and classroom changes, not individual students. The survey questions cover the foundations of psychological safety, so aim for actions that address every question.
For ideas and support, ask your School Success Lead for an end-of-term review with support from Komodo's Psychology Team.
Full guide: Psychological Safety Teacher Resource.
