
Komodo turns survey responses into scores you can read at a glance, for a single student or a whole cohort. This guide explains what the numbers mean, how to find the students who need support, and how to export your data.
Wellbeing rings and scores
On the Students page, each student has a coloured ring and a percentage.
- Ring colour: a snapshot of the student's most recent survey, from red (struggling) to green (thriving). Red is not a grade. It signals the student may benefit from a check-in.
- Percentage: the student's overall wellbeing score, averaged across the areas measured in their most recent survey. Hover over a ring to see it.
- No ring: the student has not completed a survey in the last three months.
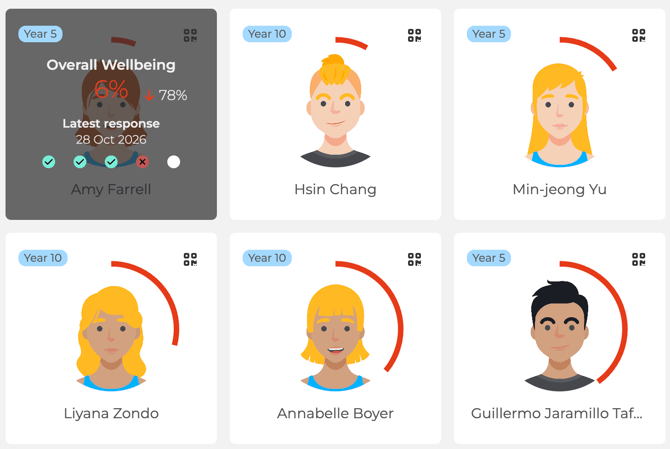
Rings are designed for staff triage. Students do not see ring colours. Secondary students see an overview of their own wellbeing over time. Primary students see a simpler view.
How scores are calculated
- Each question measures a metric, such as Friendship or Sleep quality.
- Each theme, such as Emotional Wellbeing or School Climate, is the average of the metrics in that theme that were included in the survey.
- The overall wellbeing score averages the areas measured.
Student Safety answers and the Psychological Safety survey are reported separately and are not included in the overall score.
A student's profile
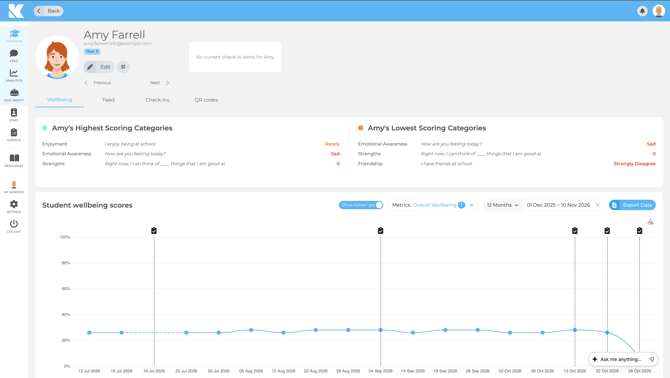
Open a student to see their highest and lowest scoring areas, their wellbeing scores over time, their check-ins and their survey responses.
Cohort analytics
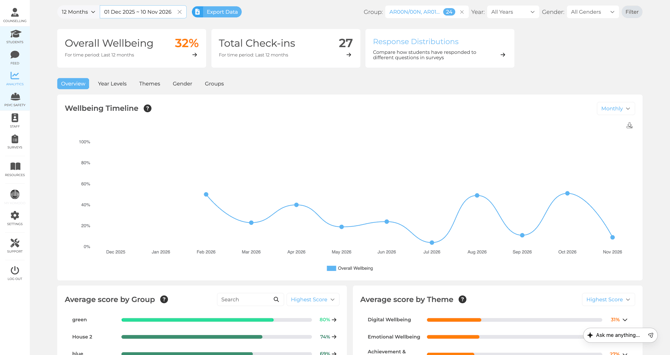
The Analytics page shows your whole cohort, or any group you filter to:
- Overall Wellbeing and Total Check-ins for the period.
- Wellbeing Timeline to spot trends month to month.
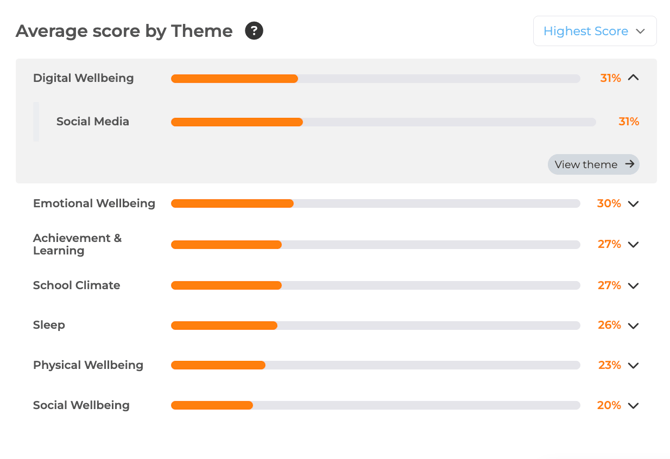
- Average score by Group and by Theme to see where to focus.
Click into a theme to see its own timeline and the metrics behind it.
Check-in analytics, including the check-in timeline and pie chart, are on the same page. Student Safety check-ins are highlighted in red.
Finding students who need support
Quick way: on the Students page, sort by Lowest overall Wellbeing. You can also sort by largest decrease.
By theme:
- In Analytics, scroll to Average Score by Theme.
- Choose a theme and click View theme.
- Under Average Score by Student, click View breakdown and sort from lowest to highest.
- For question-level detail, use Average Score by Metric.
Response Distributions show how answers were split, not who gave them. Open a student's profile to see their individual answers. Video: Finding Students with Lowest Scores .
Filters and timeframes
- Use the filters in the top right to view by Group, Year or Gender.
- Use the timeframe selector in the top left, including the previous year.
- Charts only show surveys completed within your chosen dates. The smallest period in trend charts is one month.
- Teachers only see the groups they are assigned to. If data is missing, check the filters and group assignments.
Making sense of your data
There is no single "good" score. Results depend on school context, age group and what you measure. For reference, see the Annual Trends Report 2025-26.
- Look for trends. Review cohort data together and pick a few patterns to explore.
- Equip staff. Share resources from the Resource Hub so staff can act.
- Act and review. The impact comes from what your school does next. Your School Success Lead can help you choose strategies.
Exporting data
- In Analytics, click Export Data.
- Choose cohort or individual student. Student exports can include Name, Class and Email.
- Pick a timeframe and filters, then click Export. You get a .csv file.
If an export is slow, export one term at a time, select fewer groups, or choose the combined view instead of monthly. Video: Exporting your Wellbeing Data in Komodo.
To connect Komodo to your own reporting, use the Power BI guide or the Komodo API. Exports contain personal data, so store and share them in line with your school's data protection policy.
